

Overview Reports
What this report shows
Section titled “What this report shows”Overview Reports provide a summary-level view of campaign performance. Use them to monitor click volumes, conversion counts, and rejection rates across all your campaigns in one place. Two report types are available:
- Overview Report (Global): Aggregates click, impression, and conversion data across all advertisers, publishers, offers, and sub IDs.
- Events Overview Report: Summarizes the total number of events recorded for a specific offer within a selected time frame.
How to access it
Section titled “How to access it”Navigate to Reports > Overview for the global view, or Reports > Events Overview for the events-only view.
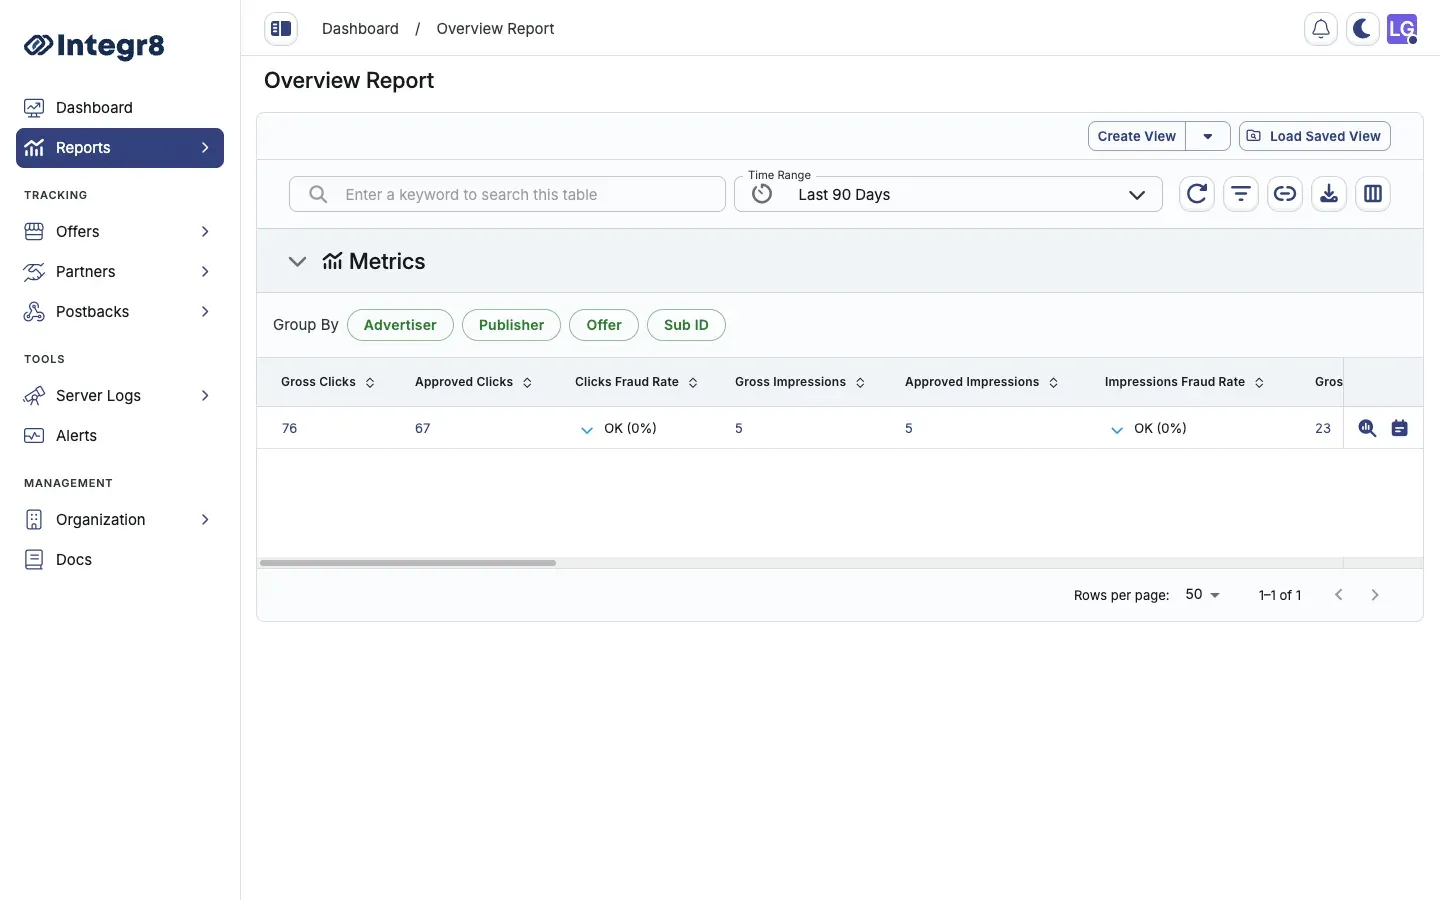
Group and read the data
Section titled “Group and read the data”Use the Group By buttons above the table to aggregate rows by Advertiser, Publisher, Offer, or Sub ID.
Most metrics are reported as Gross (all traffic), Approved (passed fraud checks), and a Fraud Rate (percentage rejected):
| Column | Description |
|---|---|
| Gross / Approved Clicks | Total and approved click counts |
| Clicks Fraud Rate | Percentage of clicks rejected |
| Gross / Approved Impressions | Total and approved impression counts |
| Impressions Fraud Rate | Percentage of impressions rejected |
| Gross / Approved Conversions | Total and approved conversion counts |
| Conversions Fraud Rate | Percentage of conversions rejected |
| CR | Conversion rate (conversions ÷ clicks) |
| Gross / Approved Events | Total and approved event counts |
| Events Fraud Rate | Percentage of events rejected |
| eCPC / eCPA | Effective cost per click / per action |
| RPA | Revenue per action |
| Gross / Approved Revenue | Advertiser revenue for the period |
| Gross / Approved Payout | Publisher payout for the period |
| Profit | Revenue minus payout |
| Margin | Profit as a percentage of revenue |
Use Edit Columns (the columns icon in the toolbar) to show or hide individual columns.
Filters and date ranges
Section titled “Filters and date ranges”- Set the reporting period with the Time Range picker (preset ranges or custom).
- Use Set Filters (the filter icon) to narrow by advertiser, publisher, offer, sub ID, or performance thresholds.
- Save a filter + column combination as a reusable view with Create View, then reopen it later from Load Saved View.
Traffic Insights
Section titled “Traffic Insights”Each row has a View Traffic Insights icon that opens a diagnostic panel — fraud distribution, traffic sources, audience profile, and device/fingerprint breakdown — for that row. See Traffic Insights.
Export options
Section titled “Export options”Click Export (the download icon) to queue a CSV export of the current report view. Large exports are processed asynchronously — download the file from Reports > Download Center once the status shows Completed.
Related reports
Section titled “Related reports”- Traffic Insights — drill into fraud distribution, device breakdown, and ISP data for any row
- Click Reports — row-level click data for deeper investigation