

Traffic Insights
What this report shows
Section titled “What this report shows”Traffic Insights is an analysis overlay within Overview Reports that gives you a quick diagnostic view of a specific publisher, offer, or sub ID row. Use it to understand the composition of traffic — fraud distribution, device types, geographic spread, ISP breakdown, and session time patterns — without leaving the overview.
How to access it
Section titled “How to access it”Traffic Insights opens from any row in the Overview Report:
- Navigate to Reports > Overview.
- Find the advertiser, publisher, offer, or sub ID row you want to analyze.
- Click the View Traffic Insights icon on that row. The panel opens as a slide-over.
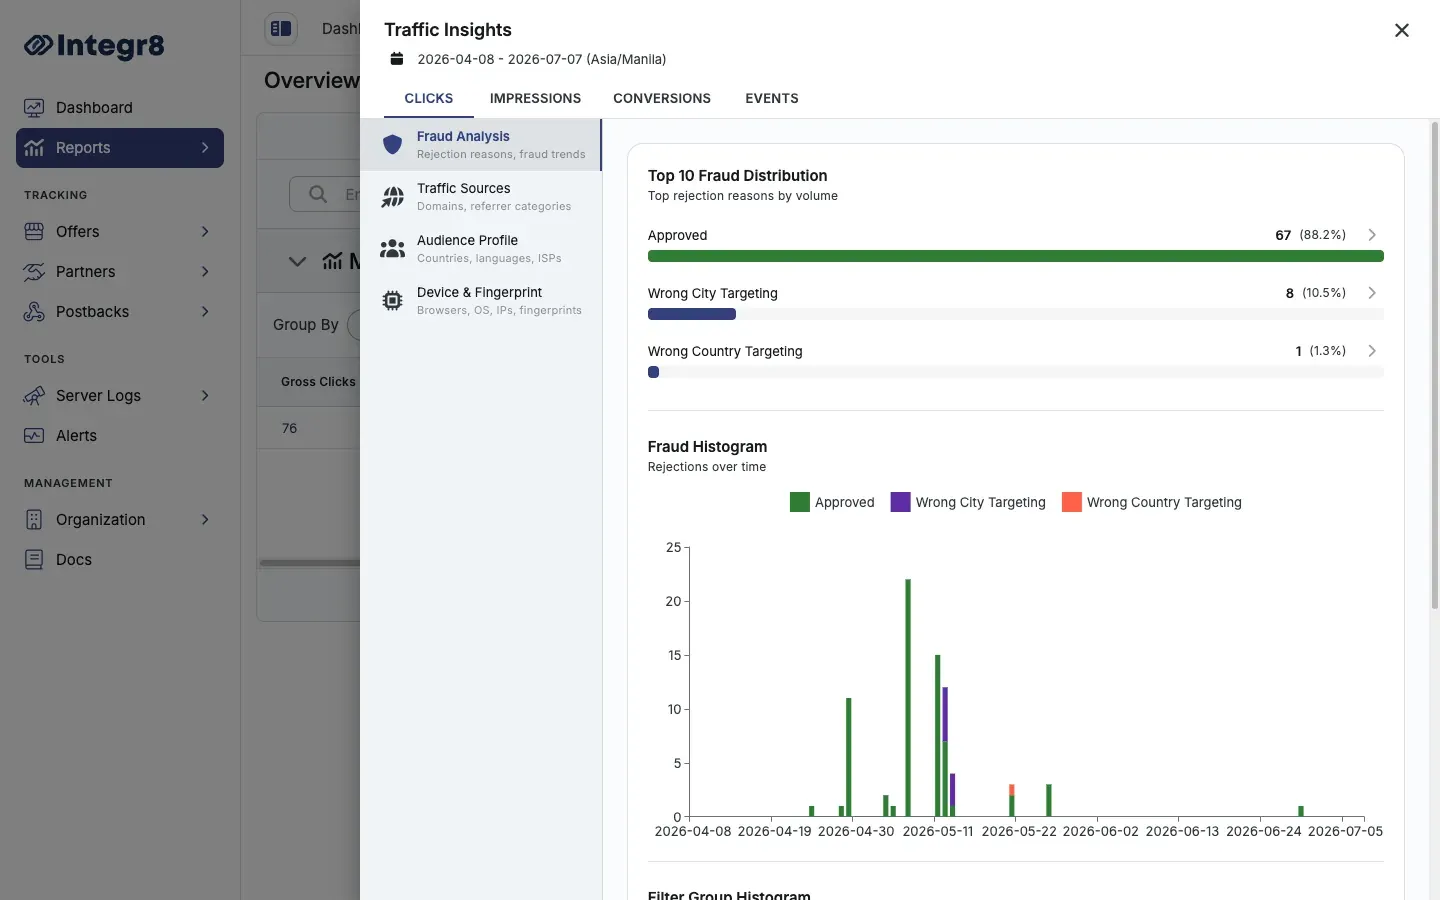
How the panel is organized
Section titled “How the panel is organized”The panel has tabs across the top for the metric type — Clicks, Impressions, Conversions, and Events — and categories down the left side:
| Category | What it shows |
|---|---|
| Fraud Analysis | Top fraud distribution, fraud histogram, and filter-group histogram (rejection reasons and trends) |
| Traffic Sources | Domains and referrer categories |
| Audience Profile | Country, language, and ISP distribution |
| Device & Fingerprint | Browser, OS, IP, and fingerprint breakdown, plus top IPs |
Filters and date ranges
Section titled “Filters and date ranges”Traffic Insights inherits the date range and filters applied to the parent Overview Report. Adjust the Overview Report filters to change the scope of the insights panel.
Export options
Section titled “Export options”Traffic Insights data is not directly exportable as a standalone file. For detailed per-record data, use Click Reports or the Event Report with equivalent filters applied.
Related reports
Section titled “Related reports”- Overview Reports — the parent report you open Traffic Insights from
- Click Reports — row-level click data for deeper investigation of specific fraud signals