
Server Logs
What this report shows
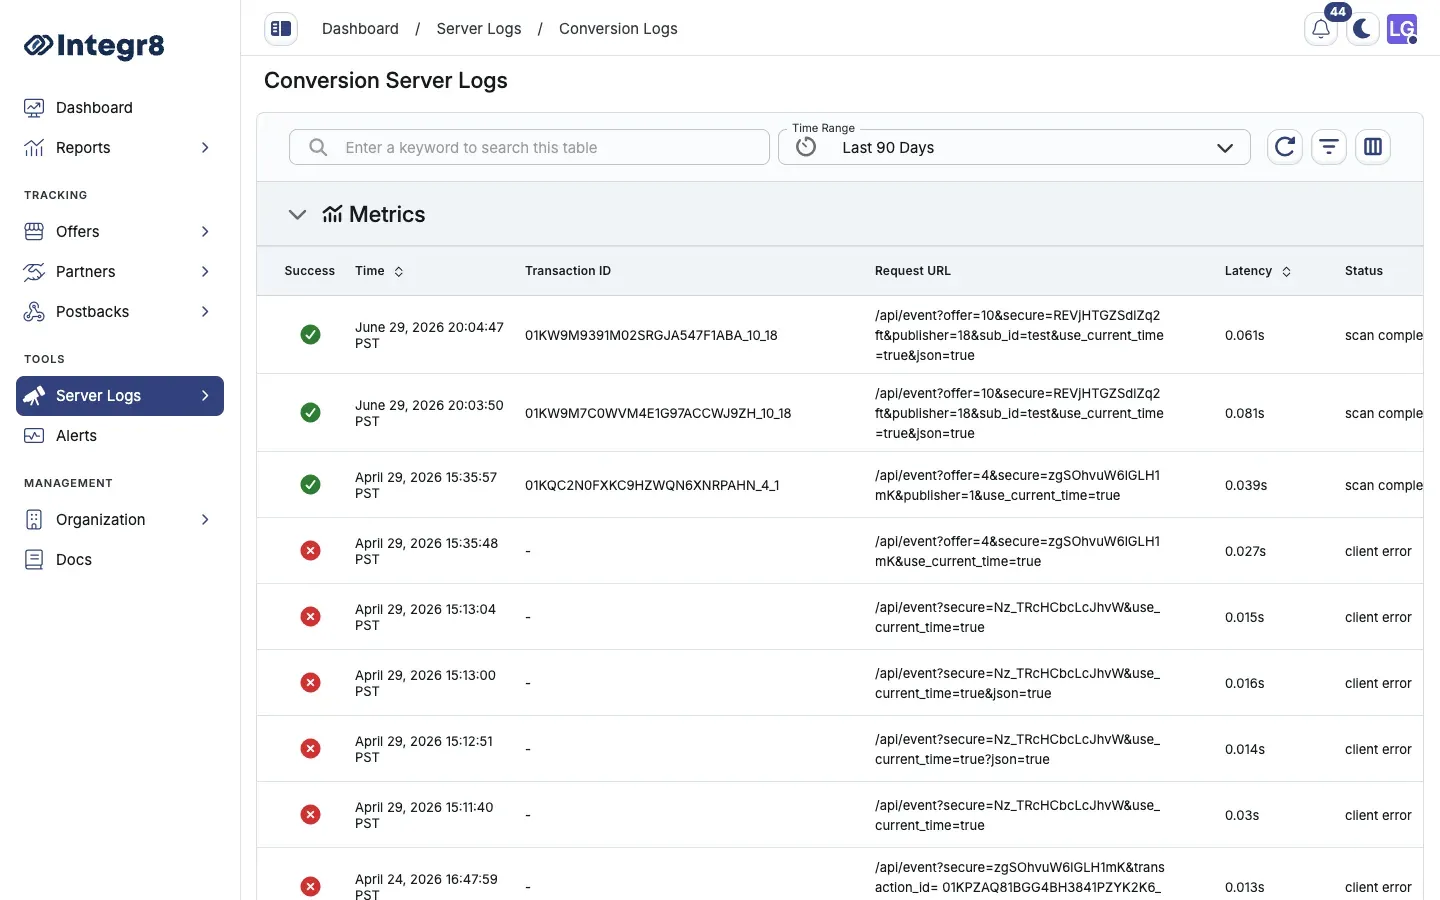
Section titled “What this report shows”Server Logs record every request received by Integr8 — including requests that were rejected or returned errors. Use them to debug attribution problems, trace postback failures, investigate conversion rejections at the raw request level, and verify that tracking links and postback URLs are configured correctly.
How to access it
Section titled “How to access it”Open Server Logs from the main menu. Logs are organized into three sections:
| Section | Description |
|---|---|
| Attribution Logs | Records of click attribution events, including accepted and rejected clicks |
| Conversion Logs | Records of incoming conversion postbacks, both successful and failed |
| Conversion Rejections | Detailed log of conversions rejected by fraud rules, with rejection reason |
Available columns
Section titled “Available columns”| Column | Description |
|---|---|
| Time | Timestamp of the request |
| Transaction ID | Unique identifier for this request |
| Request URL | The full URL received by Integr8, including all parameters |
| Latency | Server processing time in milliseconds |
| Status | HTTP response status returned to the caller |
| Metadata | Parsed parameters extracted from the request |
| Errors | Error messages if the request failed validation or processing |
Filters and date ranges
Section titled “Filters and date ranges”Filter log entries by:
- Date range — set the window for log retrieval
- Transaction ID — look up a specific request by ID
- Status — filter to errors, rejections, or successful requests
- Log type — switch between attribution, conversion, and rejection logs
When debugging a specific postback issue, find the Transaction ID from the Click Report or Conversion Report, then use it to locate the exact raw request in Server Logs. This shows you the full URL received and any parsing errors.
Export options
Section titled “Export options”Server Logs are not available for bulk CSV export through the standard Export button. Use the date range filter to narrow results, then review directly in the interface. For high-volume log analysis, contact support.
Related reports
Section titled “Related reports”- Click Reports — summarized click data with fraud reason tagging
- Event Report — event-level data with status and rejection reason